As organizations continue to adopt container orchestration
with AWS EKS (Elastic Kubernetes Service), ensuring the
reliability and performance of these Kubernetes clusters
becomes paramount. Monitoring is a critical aspect, and in
this blog, we'll explore how you can enhance your AWS EKS
monitoring efforts using Amazon DevOps Guru, AWS CloudWatch,
and AWS Simple Notification Service (SNS).
Understanding Amazon DevOps Guru:
Amazon DevOps Guru is an AWS service that leverages machine
learning to automatically identify and diagnose operational
issues in your applications. It's designed to help you
detect anomalies and understand the root causes of issues
without the need for manual investigation.
Service Benefits:
1. Proactive Issue Detection:
- Amazon DevOps Guru continuously analyses metrics, logs, and events from your AWS resources,
including EKS clusters.
- It detects anomalies, trends, and patterns that might indicate underlying issues, such as
performance degradations, error rate increases, or resource constraints.
2. Reduced Alert Fatigue:
- Unlike traditional alerting systems, DevOps Guru uses machine learning to correlate data from
multiple sources, minimizing false alarms.
- This helps reduce alert fatigue by providing meaningful alerts that require attention.
Leveraging AWS CloudWatch:
AWS CloudWatch is a fundamental service for collecting, monitoring, and analysing AWS resources'
performance metrics, logs, and events, including EKS clusters. It plays a crucial role in the
EKS
monitoring ecosystem:
1. Data Collection:
- CloudWatch seamlessly collects metrics and logs from your EKS clusters.
- It provides insights into node and pod health, resource utilization, and other critical
performance metrics.
2. Setting Up Alerts:
- You can define CloudWatch Alarms based on various EKS metrics to proactively detect issues.
- When a specified threshold is breached, CloudWatch can trigger alerts and actions, including
sending notifications via AWS SNS.
Incorporating AWS Simple Notification Service (SNS):
1. Alerting and Notification:
- AWS SNS is often used to deliver alert notifications generated by CloudWatch and other
monitoring tools.
- It can send messages through various channels, including email, SMS, mobile push, and
integration with other external notification systems.
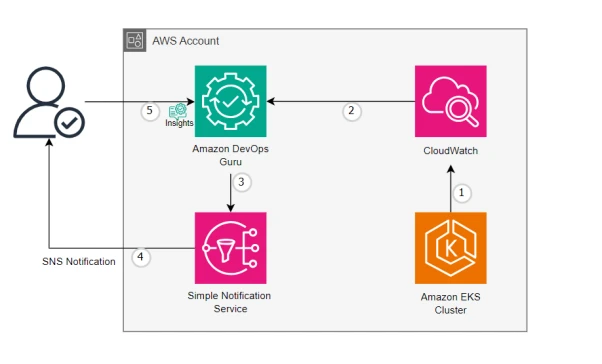
Setting Up Amazon DevOps Guru, CloudWatch, and SNS for AWS EKS:
1. Data Collection:
- DevOps Guru integrates seamlessly with Amazon CloudWatch and AWS CloudTrail, which are already
collecting data from your EKS clusters.
- You can also include custom CloudWatch metrics and CloudWatch Logs for additional insights.
2. Automatic Insights:
- After the initial training, DevOps Guru starts to provide insights into potential issues.
- It automatically groups related anomalies into insights, providing context for the problem.
3. Alerting and Notification:
- AWS CloudWatch Alarms are configured to detect performance issues and anomalies in your EKS
clusters.
- When alerts are triggered, AWS SNS sends notifications to relevant teams or individuals for
immediate attention.
Use Cases for Amazon DevOps Guru, CloudWatch, and SNS in AWS EKS:
Let's explore specific use cases where these services can be invaluable for AWS EKS monitoring:
Note:
To facilitate the analysis of Amazon Elastic Kubernetes Service (Amazon EKS) and certain Amazon
Elastic Container Service (Amazon ECS) metrics by DevOps Guru, it is essential to activate
container
insights on Amazon EKS and Kubernetes. Additionally, to generate metrics for DevOps Guru to
analyse
Amazon Simple Storage Service (S3) metrics, enabling request metrics on your S3 buckets is
necessary. It's important to note that this process may result in charges from Amazon CloudWatch
or
Amazon S3, depending on the data logged and stored by Amazon S3. For more detailed information,
please refer to the relevant documentation.
1. Enhanced Serverless Application Performance:
- Identify and address operational issues early to prevent disruptions for serverless
applications.
- Proactively improve availability and performance to ensure a seamless experience for
customers.
2. Swift Recovery for Amazon RDS Databases:
- Detect and assess a variety of database-related issues within Amazon Relational Database
Service
(RDS).
- Reduce recovery time by promptly remediating identified issues, minimizing downtime for RDS
databases.
3. Efficient Scaling and Availability Maintenance:
- Automate updates to static rules and alarms for streamlined monitoring.
- Save time and effort by allowing automatic adjustments to monitoring parameters, ensuring
effective oversight of complex and evolving applications.
4. Proactive Identification of Resource Limits:
- Receive alerts for exhaustible resources (e.g., memory, CPU, disk space) approaching or
exceeding
provisioned capacity.
- Take proactive measures to prevent performance bottlenecks and ensure optimal resource
utilization.
Conclusion
By incorporating Amazon DevOps Guru, AWS CloudWatch, and AWS SNS into your AWS EKS monitoring
strategy, you create a robust and proactive monitoring and alerting system that significantly
enhances
your ability to detect and address operational challenges. These services not only help you
identify
issues but also provide context, root cause analysis, and prompt notifications, ensuring the
reliability and performance of your EKS clusters and applications. By embracing these tools,
you're
well-equipped to deliver uninterrupted, high-performing Kubernetes workloads.


